SPC Control Chart Toolkit (Excel)
Control charts for your process in minutes: choose the chart, enter the data, and read the signals — the limits and plots build themselves.
Pick the right tab, fill the yellow cells, and watch control limits and charts calculate live — no SPC maths, no macros, no setup.
Instant download through Payhip · no delivery charge · 14-day full refund
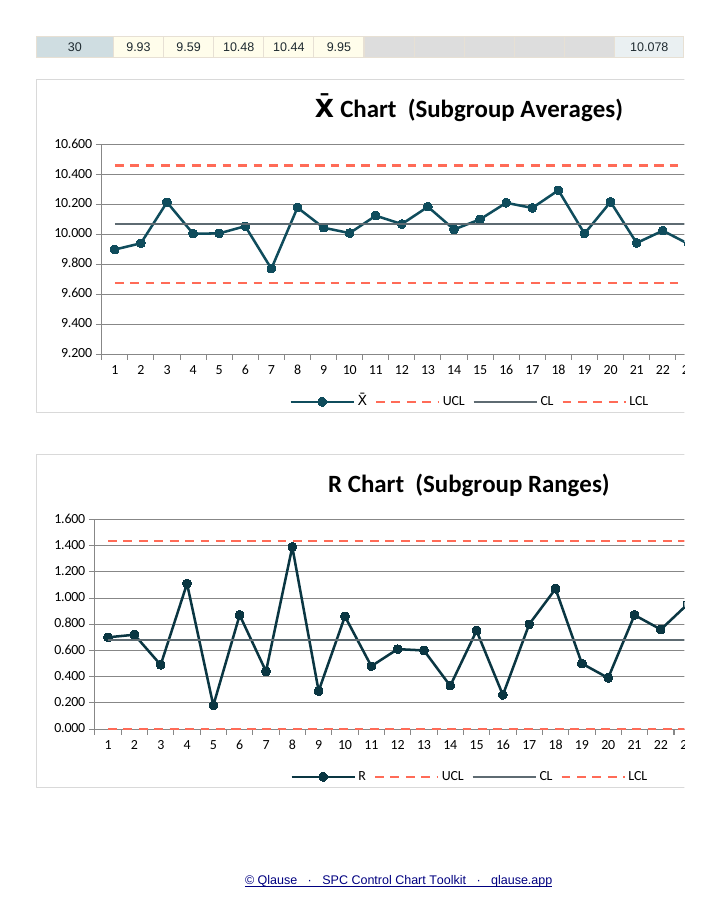
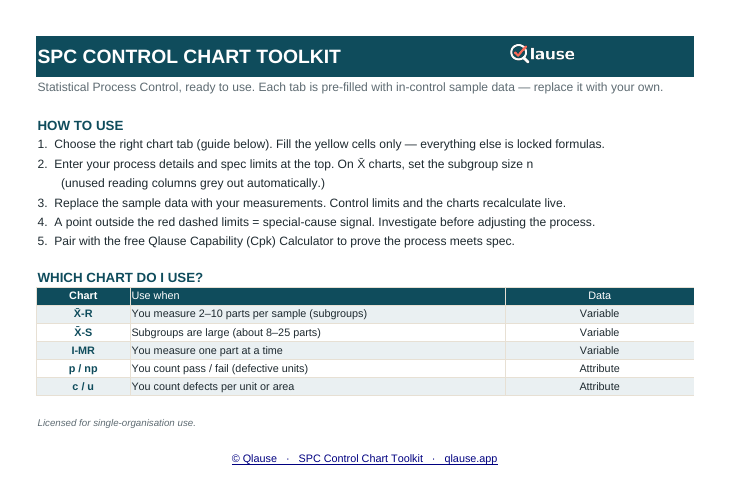
Real pages from the actual files — click any preview to enlarge.
What's inside
X̄-R chart
Averages and ranges for subgrouped variable data.
X̄-S chart
Averages and standard deviations for larger subgroups.
I-MR chart
Individuals and moving range for one-at-a-time data.
Attribute chart
p, np, c or u, switched from a dropdown, for pass/fail results and defect counts.
Start Here guide and constants
Which chart to use and how to read the signals, plus the SPC constants table the formulas use.
One Excel workbook, six sheets.
Also in Everything Bundle ($149) and Problem-Solver Pack ($49).
Limits that calculate themselves
Enter your subgroup data in the yellow cells and the centre line, UCL and LCL recalculate and replot — with your spec limits alongside for comparison.
See it used

Who it's for
Quality engineers running ongoing process control and customer submissions.
The details
- Works with
- Excel 2016 or later, including Microsoft 365. Plain .xlsx — no macros, no add-ins, nothing to install.
- Licence
- Licensed for your own and your organisation's use — every site and every user, with no per-user fees. Not for resale, redistribution or republication.
- Updates
- Free updates for existing buyers whenever the workbook is revised, sent as a Payhip product update.
- Refund
- If it isn't right for you, email hello@qlause.app within 14 days of purchase for a full refund. No reason needed.
Questions
Does it calculate Cp and Cpk?+
Capability is a separate question from control. The free Cpk Calculator does Cp, Cpk and predicted yield from your data, and pairs with this toolkit.
Can the whole team use it?+
Yes. One purchase covers your organisation — every site and every user. What it doesn't cover is reselling it, handing it to other organisations or republishing it.
What if it isn't what I need?+
If it isn't right for you, email hello@qlause.app within 14 days of purchase for a full refund. No reason needed.
SPC Control Chart Toolkit (Excel)
Instant download · licensed for your whole organisation · 14-day full refund
Start free
Qlause toolkits are interpretive tools written in our own words — not a substitute for the standards, which you need to hold licensed copies of (from SABS or ISO). All templates & toolkits